Over the last couple of years, OpenTelemetry became the de-facto instrumentation standard for collecting and observing distributed service trace information. OpenTelemetry allows users to add standardized instrumentation code within their applications with the purpose of observing traces, metrics, logs and events independent of service implementation technologies and across all the major cloud vendors. Within this […]
Category: monitoring
Observe and Report a Frequent Log4Shell Attack
This short story starts with an accidental discovery of how frequent Log4Shell attacks are executed against businesses and public internet services in general. During my daily work at Dynatrace I come to test a lot of software services along with closely observing those through the eyes of a monitoring platform vendor. I am running a […]
Observability and the Challenge of detecting Anomalies in High Cardinal Data
Observability and monitoring of software service infrastructure is the basis for modern Site Reliability Engineering (SRE) and to successfully run and scale your IT infrastructure. As the digital transformation of business processes and the shift towards highly dynamic cloud infrastructures keeps on accelerating, the dependency on human operation teams poses a critical bottleneck. Especially with […]
Combine Dynatrace, Telegraf and SNMP to safeguard a Synology Diskstation
There are many reasons why I think that a Synology Diskstation NAS is a perfect all-in-one private cloud platform. It keeps your precious family photos and documents safely stored in a RAID system and it runs your local services as well as your home automation system. Therefore, my Synology NAS evolved into a critical backbone, […]
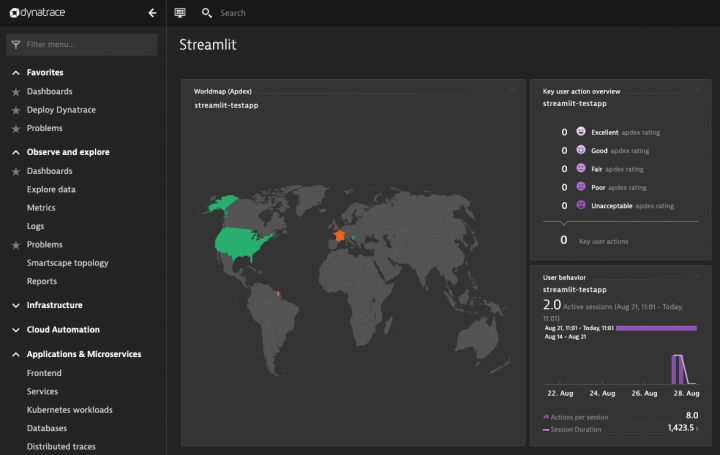
How to add observability to your Streamlit data app?
Getting insights into your users experience as well as into your real users behaviour is key within designing, implementing and delivering web applications as well as mobile applications. It’s common practice to monitor your web applications or mobile applications performance in production, to gain valuable insights about how well your application performs within your users’ […]
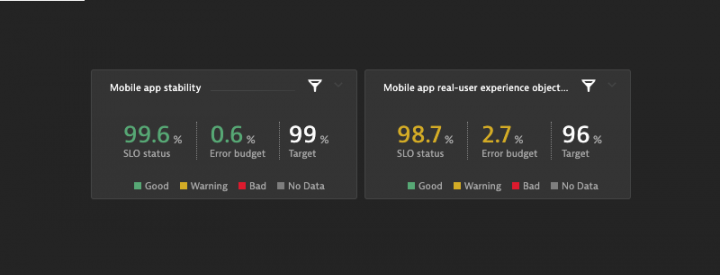
Use SLOs in Dynatrace to Safeguard your Mobile App Revenue
Developing and publishing mobile apps within global marketplaces such as iTunes or Play Store is a tough business, where many companies fail. The definition and monitoring of strategic targets by using service-level-objectives (SLO) helps to keep up stability and performance of your app and therefore safeguards your app revenue stream. Customer expectations concerning your app’s performance and reliability are […]
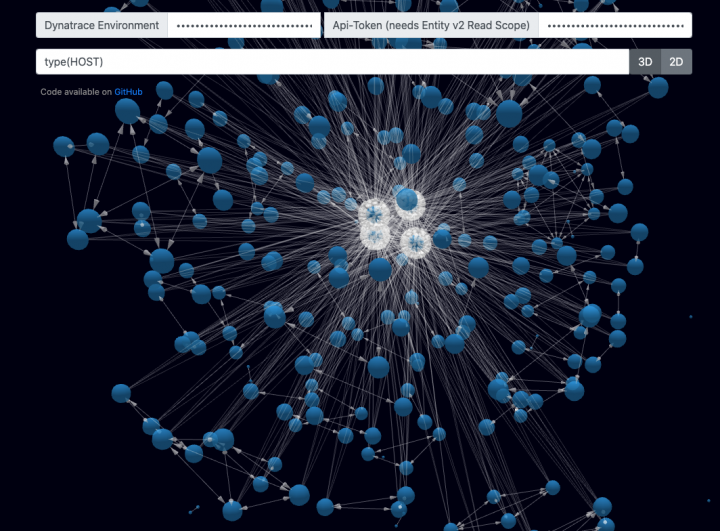
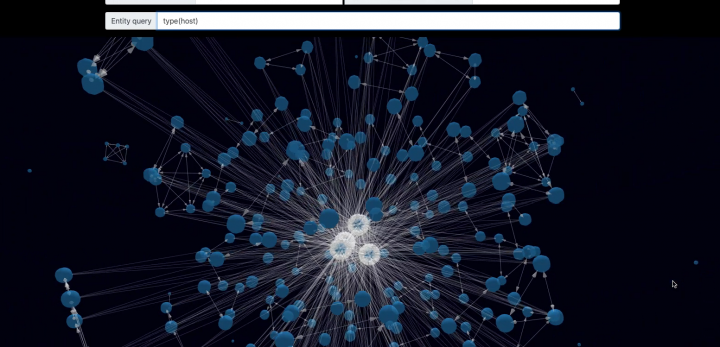
Explore your Dynatrace monitored Service Topology with an Open Source 3D Graph Browser
While designing the new generic Smartscape topology model in Dynatrace, I came across a tremendously useful 3D graphing project: force-3d-graph by vasturiano. Cudos to Vasturiano and his valuable contribution to 2D and 3D graph visualisation in JavaScript and within your local Browser. This library enabled the implementation of an Open Source 2D and 3D graph […]
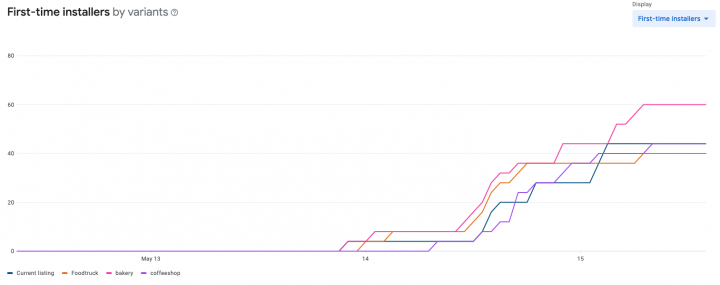
Increase your App Revenue by Optimizing your Google Play Store Presence
Congratulation, you just finished implementing your first Android app and now you are looking forward to gain some decent revenue through selling your app within Google Play Store. One aspect that I came across very soon after publishing my first Android app within Google Play Store already 10 years ago is the importance of the […]
Graph IT Service Topology with Dynatrace
Highly dynamic change in IT service topology is inevitable in modern automated deployment and delivery platforms such as Kubernetes (K8S). Tracing those micro-service IT service environments is hard to grasp for a human, as those traces and deployment stacks consists of millions, yes even billions of monitored entities. One of the unique benefits of rolling […]
Covid-19 (Corona) Visualization for Austria
Dealing with data, statistics and visualization in my daily job and locked down at home through the governmental precautions, I thought I build a Covid-19 (Corona) virus information dashboard. The dashboard is built by using Johns Hopkins University (“2019 Novel Coronavirus COVID-19 (2019-nCoV) Data Repository by Johns Hopkins CSSE”, you can download and review the […]