While designing the new generic Smartscape topology model in Dynatrace, I came across a tremendously useful 3D graphing project: force-3d-graph by vasturiano. Cudos to Vasturiano and his valuable contribution to 2D and 3D graph visualisation in JavaScript and within your local Browser.
This library enabled the implementation of an Open Source 2D and 3D graph browser for complex software infrastructures that are monitored by Dynatrace. By using the Dynatrace public facing REST API, it is possible to fetch the so called Smartscape graph and show it in an interactive and visual graph directly within your local Web browser.
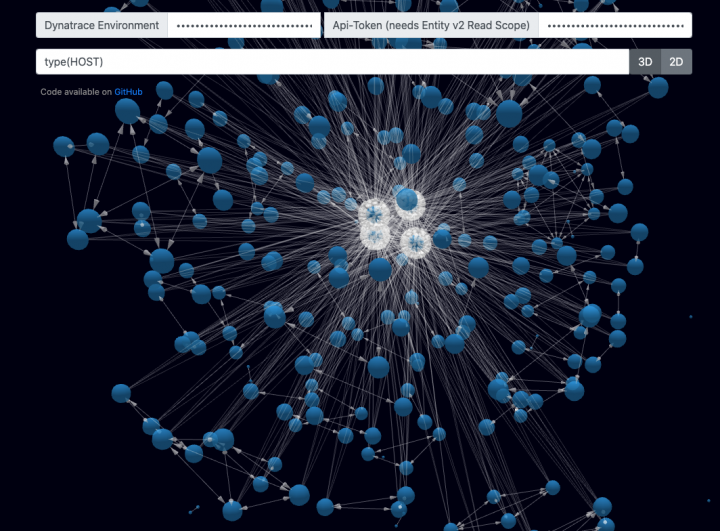
Just enter your own Dynatrace URL as well as an API token (needs entity API read access scope). Those secrets are not transferred anywhere and are only stored within your local Browser storage. Those two information are then used to directly access and query the Dynatrace Smartscape topology information in a 3D or 2D force graph.
The query field allows you to enter any entity selector query that Dynatrace defines. Therefore, you can slice and dice your topology graph by using any entity property or tags. It is even possible to use relationship queries within entities, such as show all processes running on a set of selected hosts.
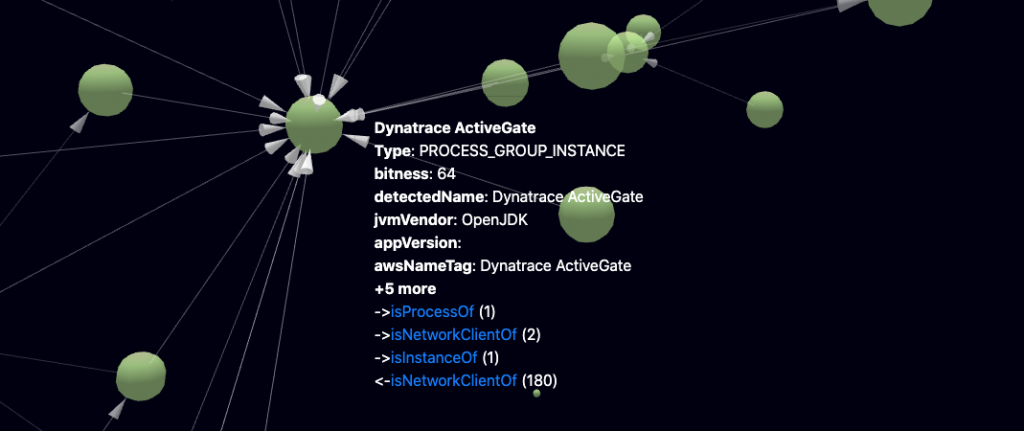
A left click on a graph node opens all the properties of the selected node and allows you to click on any node relationships, as it is shown below:

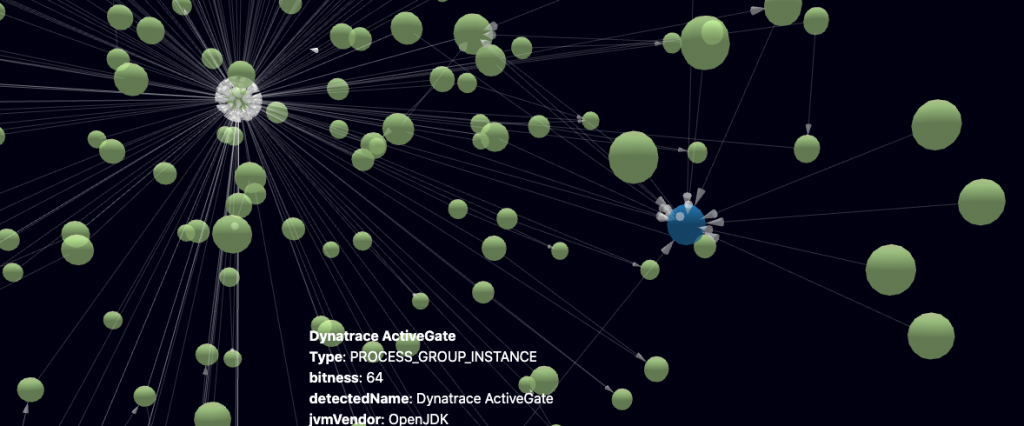
A click on the isNetworkClientOf loads those related nodes and appends them to the currently loaded graph, as it is shown below. The node color indicates that the newly loaded nodes are a different node type as the selected node.

The graph browser allows to seamlessly switch between a 3D and a 2D visualisation.
If you are already a Dynatrace user and you are interested in slicing and dicing your own service topology graph, you can try out my topology graph browser.
You find the complete open source code of the graph browser in the GraphIT GitHub repository.
